FDI facts and figures for 2019
Overall, 2019 was the best year for foreign dollars invested in Canada since 2013. According to Statistics Canada, total foreign direct investment (FDI) in Canada reached $67.2 billion, a 19.3% increase over the previous year.
This section breaks down the results in greater detail, using reported data from Statistics Canada and FDI activity data. Our FDI activity data provided more detailed insights on foreign investment projects, including mergers and acquisitions, using announced FDI projects and M&A deals reported by investors in external sources, such as press releases, compiled by fDiMarkets and Pitchbook.
For more information, consult our methodology section.
2019 at a glance
-
$67.2
billion invested
Source: Statistics Canada
Retrieved: September 10, 2020 -
353
FDI projects
announcedSource: fDiMarkets
Retrieved: September 9, 2020 -
276
M&A deals
announcedSource: Pitchbook
Retrieved: September 9, 2020 -
22,600
jobs forecasted
(excluding M&As)Source: fDiMarkets
Retrieved: September 9, 2020
-
Text version
Numbers that highlight foreign direct investment in Canada in 2019. Source: Statistics Canada, fDiMarkets and Pitchbook
Foreign direct investment activity in Canada in 2019
Foreign investment announcements by province in 2019
Source: fDiMarkets, Pitchbook(retrieved September 9, 2020)
- Announced projects and deals
- Announced investment amount

-
Text version
Map of Canada that depicts the number of foreign investment projects and dollars invested in 2019, broken down by province and territory. Source: fDiMarkets, Pitchbook
British Columbia
118 announced projects and deals, $20.4 billion announced investment amount
Alberta
50 announced projects and deals, $4.2 billion announced investment amount
Saskatchewan
6 announced projects and deals, $115.9 million announced investment amount
Manitoba
7 announced projects and deals, $118.2 million announced investment amount
Ontario
277 announced projects and deals, $30.7 billion announced investment amount
Quebec
131 announced projects and deals, $6.3 billion announced investment amount
New Brunswick
3 announced projects and deals, $250.3 million announced investment amount
Nova Scotia
11 announced projects and deals, $529.9 million announced investment amount
Prince Edward Island
1 announced projects and deals
Location not specified
25 announced projects and deals, $1.1 billion announced investment amount
Grand total
629 announced projects and deals, $68.3 billion announced investment amountProvinces and territories
Announced projects and deals
Announced investment amount
British Columbia
118
$20.4 billion
Alberta
50
$4.2 billion
Saskatchewan
6
$115.9 million
Manitoba
7
$188.2 million
Ontario
277
$30.7 billion
Quebec
131
$6.3 billion
New Brunswick
3
$250.3 million
Nova Scotia
11
$529.9 million
Prince Edward Island
1
Not available
Newfoundland and Labrador
Not available
Not available
Yukon
Not available
Not available
Northwest Territories
Not available
Not available
Nunavut
Not available
Not available
Location not specified
25
$1.1 billion
Grand total
629
$63.8 billion
Note: The 629 announced projects and deals consisted of 353 announced FDI projects and 276 announced M&A deals.
-
629
Total announced
projects and deals -
$63.8 billion
Total announced
investment amount
Promoting growth through reinvestments, mergers and acquisitions, and new investments
Foreign investments in Canada are made up of reinvestments, mergers and acquisitions, and new investments. TD Economics clarifies each of these investment types even further:
Reinvestments represent new investments by global investors who have already settled here and continue to choose Canada for new projects and investments.
Through mergers and acquisitions, global investors purchase or partner with Canadian companies to help them survive and grow.
New investments include new operations and/or expansion of global firms’ operations, but also include financial transactions such as loans between foreign headquarters and their Canadian affiliates.
Foreign investment
breakdown by type
Source: Statistics Canada (retrieved September 10, 2020)
| Category | 2019 breakdown | 10-year average breakdown |
|
|---|---|---|---|
| Reinvestments | 42% | $28.2 billion | 40.4% |
| Mergers and acquisitions | 31.2% | $21 billion | 30.9% |
| New investments | 26.8% | $18 billion | 28.7% |
Reinvestments
2019 breakdown: 42%, $28.2 billion
10-year average breakdown: 30.9%
Mergers and acquisitions
2019 breakdown: 31.2%, $21 billion
10-year average breakdown: 30.9%
New investments
2019 breakdown: 26.8%, $18 billion
10-year average breakdown: 28.7%
-
Text version
Table that depicts foreign direct investment in Canada by type in 2019, as well as the 10-year average breakdown. Source: Statistics Canada
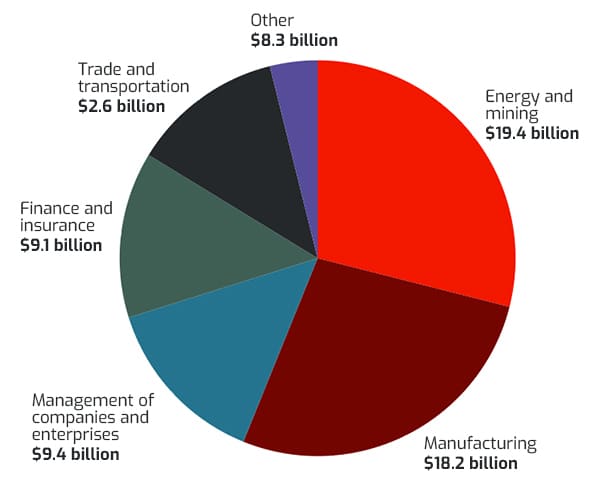
Foreign direct investment by industry
Foreign investment inflows across all industries grew significantly in 2019. Energy and mining made a far larger contribution to foreign investment compared to previous years, exceeding its 10-year average contribution to foreign investment inflows.
Foreign investment in Canada by industry 2019
Source: Statistics Canada,(retrieved September 10, 2020)
-
Text version
Chart that depicts the dollar value and percentage of foreign investments made in Canada by industry. Source: Statistics Canada.
Energy and mining: 28.9% and $19.4 billion
Manufacturing: 27.2% and $18.2 billion
Management of companies and enterprises: 14% and $9.4 billion
Finance and insurance: 13.6% and $9.1 billion
Trade and transportation: 3.9% and $2.6 billion
Other: 12.4% and $8.3 billion
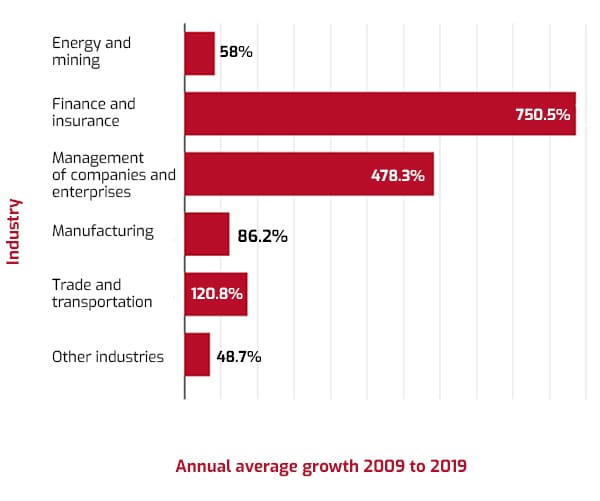
10-year average historical growth by industry
Source: Statistics Canada,(retrieved September 10, 2020)
-
Text version
Chart that depicts the annual average growth rate of Canadian industries from 2009 to 2019. Source: Statistics Canada
Energy and mining, 58%
Finance and insurance, 750.5%
Management of companies and enterprises, 478.3%
Manufacturing, 86.2%
Trade and transportation, 120.8%
Other industries, 48.7%Industry
Annual average growth
Energy and mining
58%
Finance and insurance
750.5%
Management of companies and enterprises
478.3%
Manufacturing
86.2%
Trade and transportation
120.8%
Other industries
48.7%
Canadian foreign investment results 2019
- 2.9% of Canada’s GDP
- 1.5% OECD average
- 1.2% G7 average
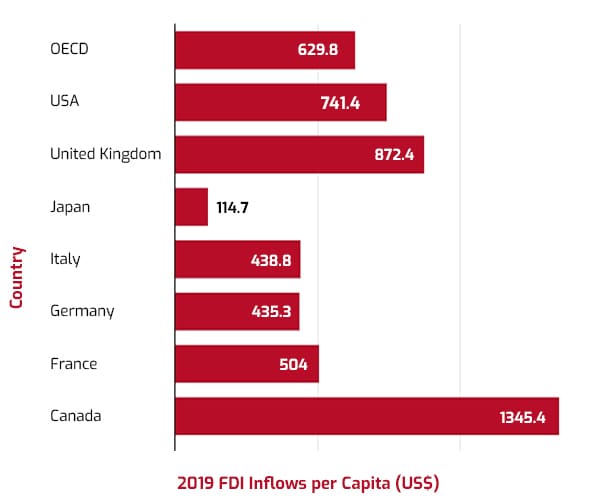
FDI inflows per capita (US$)
Source: UNCTADStat(retrieved September 14, 2020)
-
Text version
Chart that depicts Canada's foreign direct investment inflows in 2019 compared to OECD and other G7 countries. Source: UNCTADStat
OECD, 629.8
United States of America, 741.4
United Kingdom, 872.4
Japan, 114.7
Italy, 438.8
Germany, 435.3
France, 504
Canada, 1345.4
-
In 2019, Canada was the largest recipient of FDI inflows per capita among the G7 and the OECD.
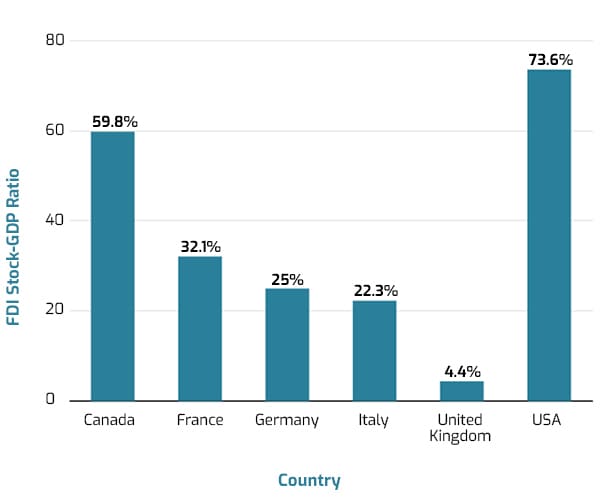
Aggregate FDI stock per GDP
Source: UNCTADStat(retrieved September 14, 2020)
-
Text version
Chart that depicts Canada's foreign direct investment stock to GDP ratio, with comparisons to other G7 countries. Source: UNCTADStat
Canada, 59.8%
France, 32.1%
Germany, 25%
Italy, 22.3%
Japan, 4.4%
United Kingdom, 73.6%
United States of America, 43.9%
-
For each dollar of GDP that is generated in the Canadian economy, Canada attracts nearly US$0.60 of FDI, second in the G7.
Investment in Canada by source country 2019 - Number of projects and deals
Source: fDiMarkets, Pitchbook(retrieved September 9, 2020)
-

346
United States
-

51
United Kingdom
-

33
Germany
-

28
France
-

21
Switzerland
-

19
Japan
-

14
Australia
-

12
Sweden
-

10
India
-

9
Ireland
-

9
Netherlands
-

77
All other countries
-
Text version
Chart that depicts foreign direct investment in Canada by source country in 2019. Source: Statistics Canada
10 years of investment in Canada
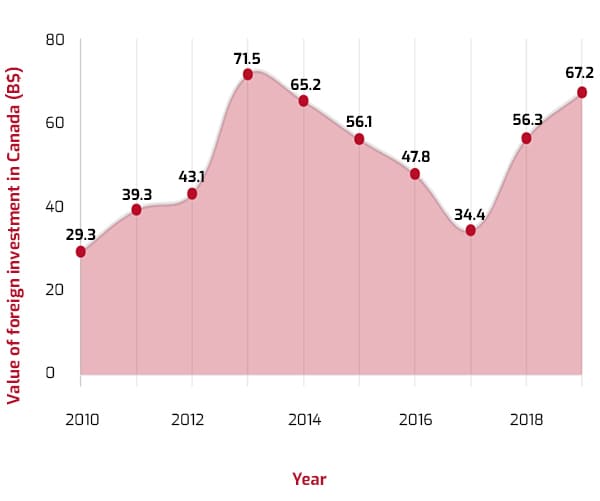
According to Statistics Canada, foreign investment in Canada is growing at a quicker pace than in previous years. In 2019, foreign investment in Canada exceeded our 10-year average growth rate.
- 14% 10-year average foreign investment growth
- 19.3% growth in 2018–2019
Total value of foreign investment in Canada, 2010–2019
Source: Statistics Canada(retrieved September 10, 2020)
- $51 billion 2010-2019 average
-
Text version
Chart that depicts the total value of foreign investment in Canada from 2010‒2019, broken down by year, as well as the 10-year average. Source: Statistics Canada
Total value of foreign investment in Canada, 2010–2019- 2010: $29.3 billion
- 2011: $39.3 billion
- 2012: $43.1 billion
- 2013: $71.5 billion
- 2014: $65.2 billion
- 2015: $56.1 billion
- 2016: $47.8 billion
- 2017: $34.4 billion
- 2018: $56.3 billion
- 2019: $67.2 billion
- 2010–2019 average: $51 billion
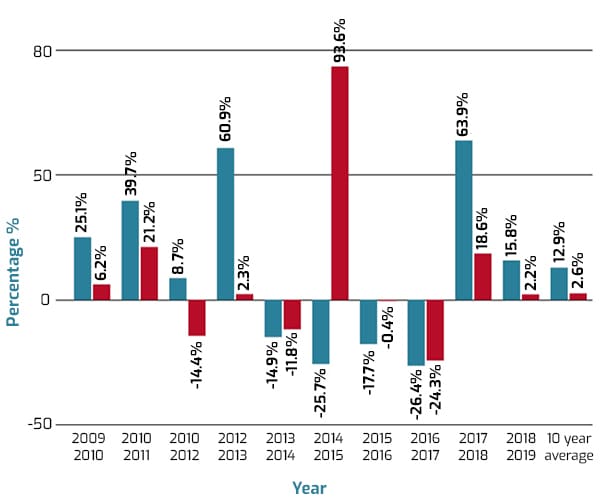
Canada’s 10-year
FDI growth rate
Source: UNCTADStat (retrieved June–August 2020)
- Canada
- OECD average
-
Text version
Chart that compares the growth of Canada's foreign direct investments to the OECD average, broken down by year, as well as the ten-year average. Source: UNCTADStat
2009-2010
Canada: 25.1%
OECD average: 6.2%
2010-2011
Canada: 39.7%
OECD average: 21.2%
2011-2012
Canada: 8.7%
OECD average: -14.4%
2012-2013
Canada: 60.9%
OECD average: 2.3%
2013-2014
Canada: -14.9%
OECD average: -11.8%
2014-2015
Canada: -25.7%
OECD average: 93.6%
2015-2016
Canada: -17.7%
OECD average: -0.4%
2016-2017
Canada: 26.4%
OECD average: -24.3%
2017-2018
Canada: 63.9%
OECD average: 18.6%
2018-2019
Canada: 15.8%
OECD average: 2.2%
10-year average
Canada: 12.9%
OECD average: 2.6%Year
Canada
OECD average
2009–2010
25.1%
6.2%
2010–2011
39.7%
21.2%
2011–2012
8.7%
-14.4%
2012–2013
60.9%
2.3%
2013–2014
-14.9%
-11.8%
2014–2015
-25.7%
93.6%
2015–2016
-17.7%
-0.4%
2016–2017
-26.4%
-24.3%
2017–2018
63.9%
18.6%
2018–2019
15.8%
2.2%
10-year average (2009–2019)
12.9%
2.6%
Methodology
The data story on foreign direct investment (FDI) for 2019 includes two components:
Actual FDI: Facts and figures of global investment in Canada on actual foreign direct investment that has flowed into Canada, produced by Statistics Canada
FDI activity: Information on announced and potential future FDI opportunities sourced from fDiMarkets (FDI projects) and Pitchbook (M&A deals)
Data for foreign investments and projected foreign investment opportunities is organized by calendar year. Furthermore, all dollar figures provided are in Canadian dollars (CAD), converted using the Bank of Canada's annualized exchange rates if not initially in CAD, unless otherwise noted.
Context
Statistics Canada’s balance of payments data for FDI flows provide actual FDI data for Canada (foreign funds that have been confirmed to have flowed into Canada). However, these numbers do not provide information on a company or provincial level.
To address this limitation, fDiMarkets and Pitchbook tools were used to provide more detailed insights on FDI activity in Canada. These tools compile foreign investment announcements, including more information on global companies announcing their intentions to invest in Canada, and the provincial destinations of these foreign direct investment announcements. fDiMarkets provides a database of announced FDI projects (cross-border investments to set up a new physical operation or expand an existing investment), while Pitchbook provides information on announced cross-border mergers and acquisitions (M&A deals).
Actual FDI
Data on foreign investments from Statistics Canada for Invest in Canada’s fiscal year was retrieved on September 10, 2020 from the following three tables, which are updated quarterly:
- Table 36-10-0025-01 (Types of investment)
- Table 36-10-0026-01 (Industries)
- Table 36-10-0473-01 (Source countries)
There are certain limitations to this data. For instance, provincial breakdowns of FDI flows do not exist across the three tables, and the industries table only features six industry categories.
Notably, there are key data limitations in the source countries table. Because information is presented on an immediate investor basis, country figures include foreign investments that occur through intermediary, or flow-through, countries. As “FDI flows capture the last country the investment was in before entering Canada,” this FDI measure does not present a full picture of which countries ultimately control the investments into Canada.
FDI statistics on an ultimate investor country (UIC) basis exist for FDI stock, or the total accumulated value of FDI during a given period of time, but not for FDI flows. Statistics Canada’s presentation of 2018 FDI stock on a UIC basis presents the source countries that have directly invested into Canada and therefore ultimately own the investments going into Canada as of the end of 2018, which is the latest data available. As of the end of 2018, the top five source countries for FDI stock were:
- U.S. (52.3%)
- U.K. (5.4%)
- Japan (4.9%)
- Switzerland (3.5%)
- Germany (3%)
Therefore, due to the limitations in Statistics Canada’s presentation of FDI flows data by source country, FDI activity data (see below) was used instead in the source country analysis for 2019. Announced projects and M&A deals were broken down by their source country and number of projects and deals.
FDI activity
FDI activity data for 2019, which represents announcements from global companies investing in Canada, was retrieved on September 9, 2020. This data is composed of two parts:
- FDI projects, which are announced cross-border investments to set up a new physical operation or expand an existing investment
- Announced cross-border M&A deals
FDI projects data is sourced from fDiMarkets and M&A deals data is sourced from Pitchbook. The original source for the majority of the FDI projects and M&A deals, amalgamated by both tools, are company press releases.
This data is further segmented by source country and destination province or territory (including an urban and rural breakdown), project or deal category, and industry. The data provides details on projected investment amounts to varying degrees, depending on whether the FDI announcement is for an FDI project or an M&A deal. Specifically, for announced FDI projects, fDiMarkets provides projected investment amounts, referred to as capital expenditures (CAPEX). For announced M&A deals, investment amounts are provided when they are disclosed publicly by the acquiring company.
One key limitation of this data is that projected FDI opportunities come from external announcements, which are not necessarily confirmed projects and deals. An announced FDI project could take several years to materialize into a confirmed FDI project, assuming it moves forward. Similarly, an announced M&A deal may take a few years to materialize and the investment announcement may be split over different reporting periods.
This data is intended to provide a pipeline of potential and future opportunities of global investment in Canada from province to province, rather than a complete picture of job and dollar amounts.
Footnotes
In Statistics Canada’s balance of payments data for FDI flows, this is referred to as “Other flows.” Return to footnote 1 referrer↩
UNCTAD FDI Stock data at market value, measured in US$. Return to footnote 2 referrer↩
Global Affairs Canada, Canada’s State of Trade 2020 Return to footnote 3 referrer↩
Global Affairs Canada, Canada’s State of Trade 2020 Return to footnote 4 referrer↩
Statistics Canada, Table 36-10-0433-01 (retrieved August 18, 2020) Return to footnote 5 referrer↩
fDiMarkets’ FDI projects data does not include M&A and other equity investments. Return to footnote 7 referrer↩
In our FDI activity data, IIC classifies a destination (i.e. city, town or community) as rural if its population is less than 20,000 people. Otherwise, the community is considered urban. Return to footnote 8 referrer↩
Within the fDiMarkets database, estimates are typically provided when jobs created figures and investment amounts are not initially provided in the external announcements. Out of 353 FDI projects on fDiMarkets, only 19 projects provided an investment amount in the original media announcement. The remaining projects’ investment amounts were estimates based on fDiMarkets’ algorithm. Return to footnote 9 referrer↩
From the total announced M&A deals for 2019, investment amounts (i.e. disclosed deal size) were only provided in 102 out of a total 276 M&A deals on Pitchbook. Return to footnote 10 referrer↩